
Invest in Cryptocurrencies
Haven't you bought cryptocurrencies yet? Well now is the time to take the step easily and safely
67% of retail investor accounts lose money when trading CFDs with this provider. You need to consider whether you can afford to take the high risk of losing your money.
Crypto assets are highly volatile unregulated investment products. No EU investor protection.
They say that when the market goes bad and prices fall, everyone loses. Are you sure? Trading is one of the most widespread forms of make a profit in whatever direction the market may go. That means that whether the price goes up or down, and we can anticipate the direction of the movement, we can make a profit. I think there is a consensus that we all like to win, and cryptocurrencies offer that possibility as well. Why not value it?
We are going to explain some basic concepts, for those who are not very familiar with trading, how what are Japanese candles. Then, medium or more advanced concepts to discover new strategies or perfect those that you may already have. Before starting, It must be taken into account that these practices carry a high risk. It is the responsibility of each one, the decisions that can be made. My recommendation will always be (and this is the most important thing) not to "gamble" on something that is not understood what it is. With that said, let's get started!
[highlighted]>> Invest in Cryptocurrencies NOW67% of retail investor accounts lose money when trading CFDs with this provider. You need to consider whether you can afford to take the high risk of losing your money.
Crypto assets are highly volatile unregulated investment products. No EU investor protection.
Cryptocurrency Trading Basics
We are going to start by explaining some of the key data to do Trading. All the existing range does not end here, but we will detail the key points that we consider essential.
Broker Selection
It is something very personal, because everything in trading is in the end. Before launching one, which is often accompanied by aggressive offers or advertising, I always recommend seeking opinions and advice online. The guarantees that we should look for for our election would be:
- Reliable and Serious Broker: We are going to deposit our money in it. We do not want to have problems or mishaps, or how on some occasions I have read, people who have not been able to withdraw their funds.
- That is regulated: In the case of Spain, the body in charge of ensuring proper functioning is the CNMV, the National Securities Market Commission. There are brokers, which are regulated in more than one country, for example the XTB broker.
- Transparency: If when joining the website of one that we like, we find that we have some difficulty in finding information, it is not what we expected. We want a site that correctly specifies the conditions of Trading and its Products. For example, I particularly work for a long time with activities to do Trading. On its website, the conditions of each product, costs and commissions, as well as quantities and guarantees that they request are very clear. That's what we are looking for. In this case, Activtrades is regulated by the FCA, the UK financial authority, operating outside the UK government.
- Customer Opinions: Forums, blogs or other internet pages. We care about the opinion of who has worked with whom we are thinking of working. Above all, the serious appraisals. There are those who have had problems withdrawing their money (from sites that I know are serious), because they "have not identified themselves" correctly, and they spit on certain places. I leave it there…
Japanese Candles
They are the most common type of chart used in trading. Japanese candles provide us with a lot of information as soon as we see them. In trading lingo, it is common to call them by different names in order to differentiate or refer to them. Whatever name is provided, the information does not change. The candle remains the same, a candle. The important thing now is that each of them, it shows us the path that the price (quote) has experienced throughout the selected period of time. That is, the time frame with which we work or see a graph.
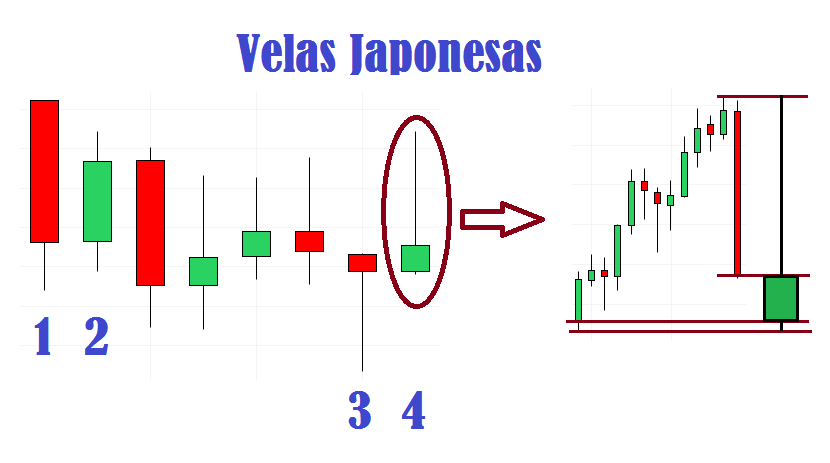
A candle can be 1 minute, 5 minutes, 15 minutes or up to a day or 1 month. For the case referred to in the image, I have selected 4 candles. Number 1 shows us that during that period the price fell as soon as the candle began to be drawn. The line or wick at the bottom is the path that the price experienced, where it fell to that level, to finally close a little higher. Once the candle is closed (time has elapsed), the next one begins to be drawn, and it will be doing it during the same interval as the previous one, which is the selected one.
Candle 2 opened in the same area that closed 1. That's because it was the continuation. Here the price went down, to then go up a lot and go down a bit at the end. Candle 2 was a candle where the price rose. At first it is normal that it is difficult to see so much information at a glance, but you get used to it, it is almost faster than reading. Finally, I have listed 3 and 4. In this case we have what is often referred to as a "hammer candle." The price rises or falls to finally turn around in the opposite direction and leave us candles with small bodies and large wicks. I have taken candle 4, to show you in a smaller temporality, what had really happened, and understand why that candle.
Amount of Cryptocurrencies to Trade with
Be careful with the quantities we buy! I'm not saying this to get defensive or on the alert, but you have to pay attention. Usually we are going to trade cryptocurrencies using the famous CFDs (contracts for difference). That means that the seller (the broker) will pay the buyer (us) the difference between the initial and final value of each operation. Roughly speaking, if we buy 1 Bitcoin at 3500 dollars, and we consider selling it when it is worth 3600, they should pay us 100 dollars. So far good.
 The problem is that we have to calculate how much we should buy. CFDs are contracts, and the underlying asset is not usually directly 1 unit, unless it is expensive, for example Bitcoin itself. Let's see a couple of examples:
- 1st case. We want to buy Bitcoin. The broker tells us that each lot of Bitcoin CFDs is made up of 1 Bitcoin. We buy 0 lots. If Bitcoin were at 1 at that time, we would be buying one-tenth. $ 3600 x 3600 = $ 0,1. That is, if the listed price went up or down by $ 360, we would be gaining $ 400 or losing it.
- 2nd case. We want to sell Ethereums because we think the price is going to fall. The broker tells us that each Ethereum CFD lot is made up of 10 Ethereums. We, who have been successful with our rise in Bitcoin and the $ 40 seemed little to us, we decided to sell more, but of Ethereums. Because if it is now trading at $ 120, if it drops $ 10 we think it will give us little benefit. We will sell 10 lots (and this is a typical mistake). If we sell 10 lots of Ethereum, where each CFD is made up of 10 Ethereums, it will be a total of 100 Ethereums (10 lots of CFDs each made up of 10 Ethereums). So ... 10 lots x 10 Ethereums x $ 120 of price = $ 12.000 !! If the price rises instead of falling, we would go into losses. Every dollar that the price rises, we would lose $ 100.
Por eso emphasize that you have to be clear about what you are buying, and how much. If things went well, and we bought more, a joy that we take with us. But we better avoid scares, in case it goes wrong.
Types of Trading Orders
Trading orders they help us to better manage our operations. Often times, our way of interacting with the market will vary depending on our objectives. For this reason, we are going to summarize the most common and used.
Orders out of the market
- To Market: For the impatient, or because the moment tells us that we should buy. Once the buy or sell order is launched, it will be executed at the quoted price where it is at that moment.
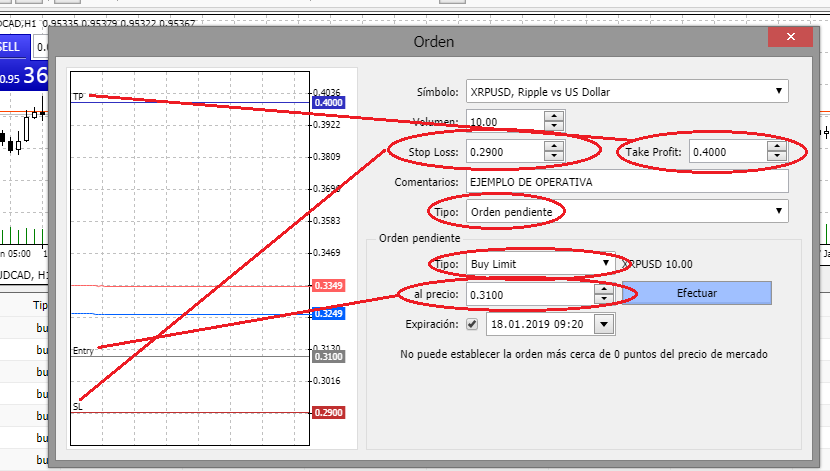
- BuyLimit: We imagine that we have a Ripple at 0,3324 and we have detected a support, or we believe that the price will not fall more than a certain point, for example 0. When entering the order, it will not be executed, but will remain in standby mode. If we "disconnect", because we are going to sleep, to work, or whatever, in case the Ripple falls and reaches 31'0 or less, the broker executes the order.
- Sell Limit: The same, but in reverse than the Buy Limit. We want to sell at 0'34, and the Ripple, is at 0'3324, we enter the order. As soon as the Ripple reaches 0'34 our sell order will be executed, whether we are connected to the broker or not.
- Buy-Stop: We want to buy, the Ripple is at 0'3324. We believe that if news comes out that is going to benefit you, or we expect a strong move because our technical analysis predicts it, etc., the price may skyrocket higher. Meanwhile, it is on the side, and we are not sure. A Buy Stop helps us to mark a buy order if the price reaches a higher level than the current one, for example, 0'3380. When the quote gets there, our buy order will be executed.
- Sell Stop: The same as the Buy Stop, but in reverse, for sale. If the price reaches a level lower than the current 0,3324 and we want to place a sell order that triggers itself as soon as it reaches the level we define.
Orders within the market
- To market: With our operation done, at some point we must close it. Selling at the market is the best way to close the operation instantly, and it will always be executed at the price that is at that moment.
- Stop Loss and Take Profit: We are in the operation, but we do not know if the price will go down or up a lot. Whether we are buying or selling, we can mark a Stop Loss or Take Profit, to stop losses or obtain profits and close the operation without having to be connected.
Understanding the Cryptocurrency Market
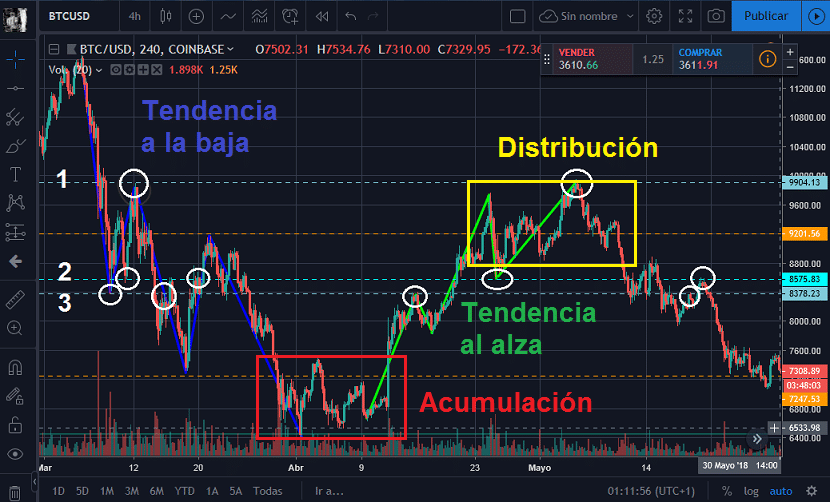
If we want to do a good trade, it is important to understand where we are in the market. To do this, the best way is locate which direction the market is going. It consists of 4 phases. In the case analyzed, its downward trend can be identified, then an accumulation zone, followed by an upward trend, and culminating in a distribution zone. If it had continued charting, the following would be a downward trend. The best way to identify them are all the maximums and minimums that are developed.
Another important and recommended factor is mark the «levels» in which the price has turned around. They are usually called Resistance zones (if the price rises and when touched it returns to the drop), or Support zones (if the price goes down and when touched it bounces up). For this case, I have marked all the highs and lows of the first trend that we can identify. The horizontal lines are the levels where the price has changed direction. These levels in the future, and depending on our strategy, "we hope" that they can serve as strong points of change of direction of the price.
Next, I show the evolution of what would have happened in the future after those levels. In the first image, I have marked with white rounds as an example, to identify why those levels are important. I have not marked all the points, so as not to load the image too much. Now in the second, we are going to see what would have happened if we left those levels for the future. In case you are interested, you can find these graphics in Tradingview.
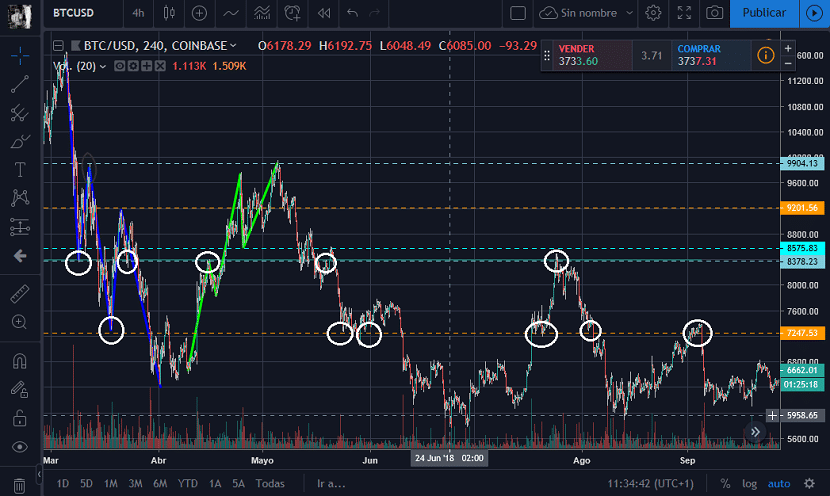
In this graph we can see how the old line 3 (level) has continued to be important months later. In fact, at the end of July 2018, it was the most important place to turn the price down, I act as Resistance. On the other hand, the orange level that initially worked "somewhat", makes clear the importance of this level in the future, which acted as both Support and Resistance.
Cryptocurrency Trading Strategies
There are multiple strategies for the Cryptocurrency market. From candlestick patterns, on trends, with indicators, etc. Depending on the personality of each one, as traders we must always look for what is more related or comfortable for us. Next, we are going to give an example with the RSI indicator. It is one of the best known and most used, because it is easy to interpret. The RSI is an oscillating indicator that tells us, taking into account some formulas, if the price is overbought or oversold. To do this, a scale from 0 to 100 is used. The closer it is to 0, the more oversold (cheap) the price is. On the contrary, the closer to 100, the more overbought (expensive) it is.
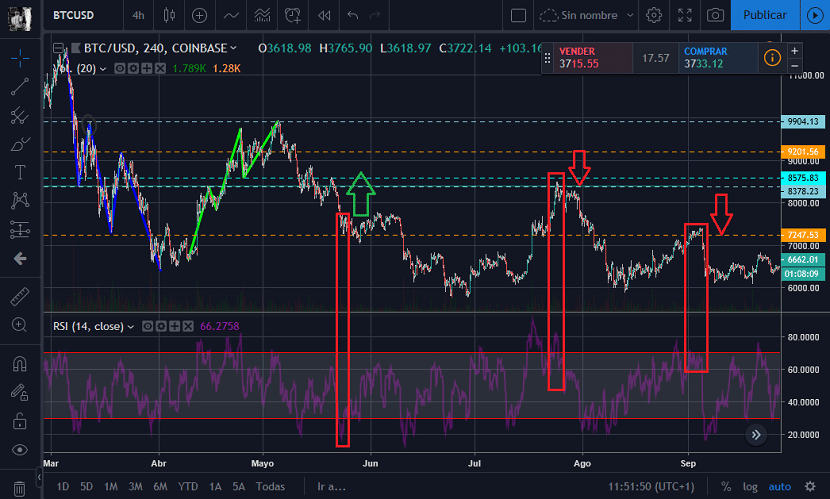
In this third image, we can see the RSI at the bottom. It strikes us, as the price seems to go up and down between the two red lines, and sometimes it even goes out. These levels represent 70 and 30 points out of 100, which we have discussed in the previous paragraph. From here, one way to operate the RSI is to buy when it tells us that the price "is cheap", or to sell when it tells us that it is "expensive."
Taking into account everything we have learned above, we can make a mix between Trends + Levels + RSI. In this case, the first operation would not have been very successful, while for the other two it would. Over time, and learning to place buy / sell orders, stops, etc., which can now even saturate anyone with information, it becomes more agile. Practice and experience is a degree.
Note that it does not mean that this method will always work, and is infallible. What's more, whenever we learn, or come up with a new strategy, we must subject it to rigorous scrutiny to see if it works. We are risking our money, many people win, but there are many who also lose it. We cannot get carried away by first impressions. To know if a strategy is good or not, we always have to perform a Backtesting.
Cryptocurrency Trading Backtest

The backtesting or backtesting is one of the most powerful objective techniques to manage our emotionality in trading. Its essence is basically to check if a technique, or candlestick pattern, or movements that we believe can bring us benefits, has worked in the past. By performing a backtest, we will be able to determine if our strategy will really be effective in the future.
It is not an absolute guarantee always, but emotionally it helps us in our decisions. Sometimes, it will seem to us that we should operate a cryptocurrency or not, depending on what we feel at that moment. With the backtest done, what we do is put the strategy into practice when the right moment occurs, without entering into internal dialogues or emotional decisions.
We hope that this article has served you as a reference to learn how the world of Cryptocurrency Trading can become. This is only a small part of how huge it is. Remember that before venturing into any initiative or action, in the end it is your responsibility to be sufficiently prepared. If you keep going, we wish you the best of luck and success. Good crypto trading!